
Top Tooltip Tips
Introduction
Tooltips are one of those small features that can either quietly help a user or instantly annoy them.
In Planning Analytics Workspace cube views, hovering over a member has traditionally shown the member name or description based on the set’s configuration.
With the newer configurable tooltip option, we can now choose a member property or attribute to display instead. This opens up some useful possibilities: from simply restoring a familiar caption-like experience, through to showing richer descriptions, usage notes, or even rule-derived context that changes with the data.
I am going to move through this in stages: first looking at what the tooltip is showing by default, then how to configure a simple replacement, and finally how to use attributes and rules to turn the tooltip into something genuinely useful for the user. That order matters, because the more advanced examples only make sense once we are clear on what Planning Analytics is doing out of the box.
The Default Tooltip
You may have recently noticed that hovering over a member displays a tooltip that appears to be a long and largely useless bit of text for each member e.g.:
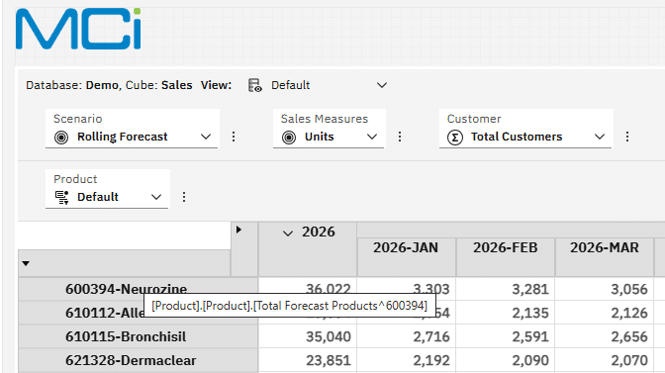
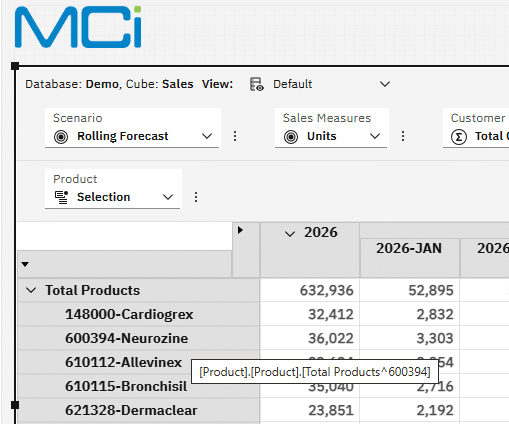
What is actually being shown here is the Member Unique Name (MUN). This is the fully qualified name of the member and includes the rollup context that the member is being displayed under.
In the above example I had the Total Forecast Products rollup selected and expanded to show the leaves only.
If I had used the Total Products rollup I would have seen the following:
Making it Your Own
Ok, so now we know what is being shown but how does this help a user?
The short answer is that it does not really help the user and in most cases is unlikely to. It may be useful for technical context and when working with MDX but only if you had a way to copy members from those shown on the rows or columns.
As of Planning Analytics Workspace version 2.1.19 you can configure tooltips for members displayed in the cube viewer. In practical terms, you can configure what a user sees as the tooltip. The tooltip can be linked to certain intrinsic members as well as string and alias attributes. This option applies to rows and columns but not context members.
To change what is being shown as the tooltip you simply need to right-click on the row or column hierarchy header in the widget. This is the grey area above the members. In the example below, this is the area that shows Product because I changed the option in the format manager to show the hierarchy name.
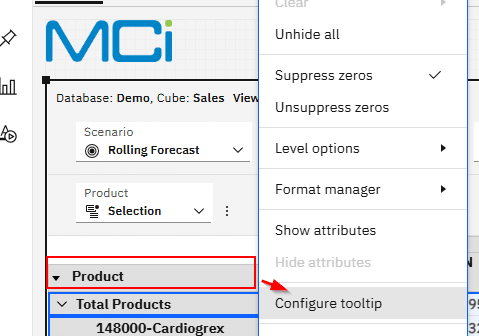
After clicking the Configure tooltip option you should see a dialogue box with a dropdown menu. Note that the default option is Member Unique Name which we saw earlier.
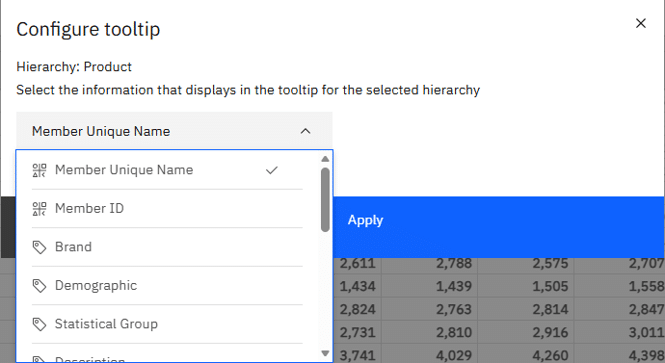
Choosing Member ID gives me the following tooltip which in my case is not useful by itself.
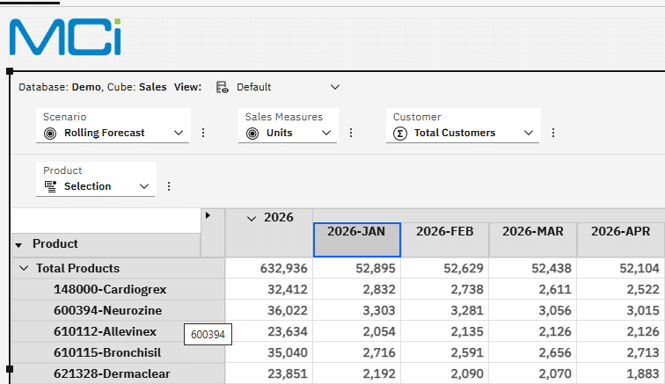
It can still be useful in views where the user is looking at an alias and you want the tooltip to show the principal member name as additional context. My current set is using my Caption alias which shows the code and description.
If I was only showing the code for whatever reason, I could configure the tooltip to show the Caption:
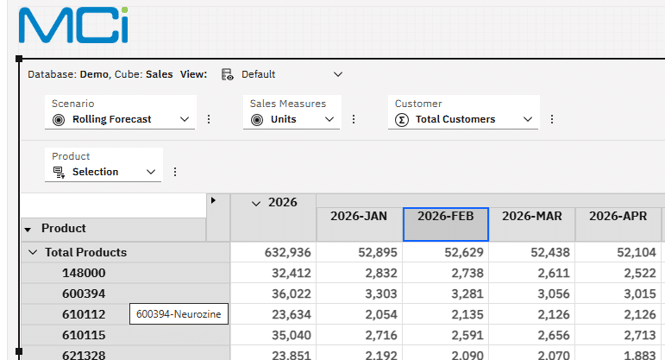
At this point we are more or less back to where we were before upgrading to PAW 2.1.19, where the tooltip simply mirrored what we were already seeing for the member. If that is all you need, it may feel like extra work to restore familiar behaviour. As far as I know, there is currently no way to save these tooltip settings for new views to automatically use your preferred attribute or property. For each cube viewer, you will need to pick the appropriate tooltip to show.
Smarter Tooltips
On a more positive note, there is so much more that you can do now with a little extra configuration. As mentioned earlier, the tooltip can be one of the intrinsic properties or based on a string attribute or alias.
String attributes are of particular interest as you could get creative with these to give the audience a lot more than what they used to have letting us move beyond simply repeating a code, caption or description.
Having a much longer description or narrative as a tooltip may give users more insight than the code and short description. By creating a new string attribute and assigning it as the tooltip, the tooltip can become a quick reminder of what the product is used for rather than just another label:
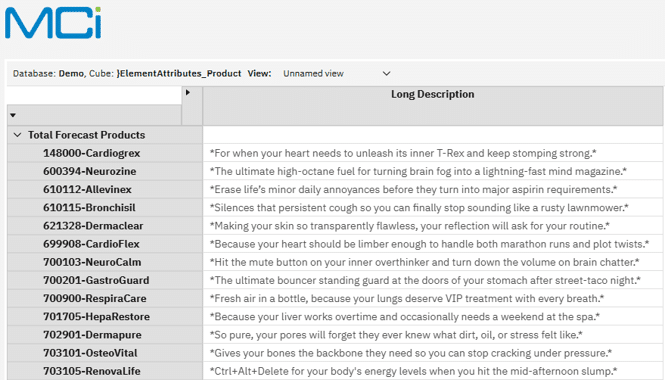
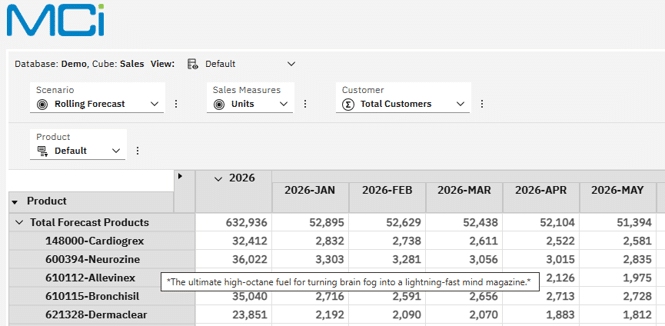
The user can now get a little bit more out of the tooltip than previously, and this may jog their memory through the longer narrative.
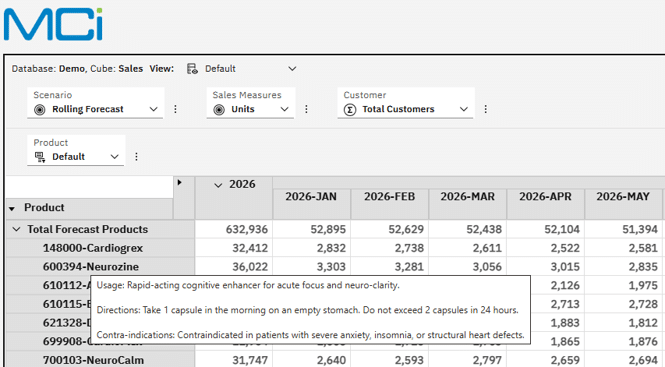
The same concept can be extended further by creating a paragraph or multi-line text. In my case I want to show the reader a bit more information about each product’s usage, description and contra-indications, so the tooltip could provide lightweight guidance without sending the user to another report or reference tab.
I created a new attribute and uploaded the updated text to be displayed as the tooltip. You could do this manually too using F2 on the attribute cell to open the string window. Use Alt+Enter to give you a new line.
After updating my tooltip to look at the new attribute, I now have the following displayed:
Dynamic Tooltips
Because we are dealing with attributes, their value could be loaded or input as in the previous examples. Attributes can also be rule-derived from underlying master data or data which is where the tooltip really starts to become dynamic rather than just descriptive.
In my attribute rules for Product, I build a string to display the date the Product was first introduced and the sales for the prior years across Total Customers. I am using a combination of text, attributes and values from my Sales cube to build a multi-line string. Using CHAR(10) gives me a new line and using two gives an extra blank line for readability.
This gives me a dynamic tooltip for each Product based on its master data and data.
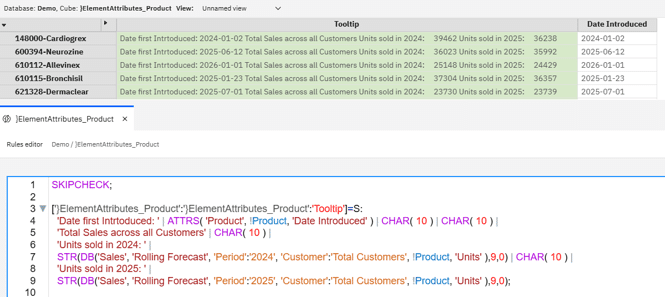
Setting the tooltip on my cube viewer to the new rule-derived attribute Tooltip, I can see the following:

Using a rule makes the tooltip more dynamic. Depending on the rule, it can give additional context that is relevant to the user, such as recently updated sales information, master data details, or values that would otherwise require the user to open another view.
Keep in mind that even though the attribute may be dynamic, if you are in the cube view and the underlying master data or data changes, the tooltip will only be updated if you refresh the view. This is likely not an issue for most use cases.
If you are the user making the update on dependent master data or data for the tooltip then your change triggers an update to the tooltip. This may be useful if you are showing a tooltip that needs to be updated after a change in data. Maybe an example is showing the expected full year Sales Revenue. As the user updates the planned Units, the Sales Revenue would change and hovering over the Product would show an updated position without the user needing to review another report or tab.
Conclusion
For me, the real value is not the feature itself but the progression it allows. Start by replacing the default MUN with something recognisable, then use attributes to add helpful descriptions, and finally consider dynamic, rule-derived attributes where the tooltip needs to reflect changing data.
Used intentionally, tooltips can become a small but useful layer of guidance for users.
Enjoy configuring your tooltips and please share some of your experiences with me so that others can see how tooltips can add value to the user experience.
By George Tonkin, Business Partner at MCi
Further Reading
Part 1 – Learning MDX view in Planning Analytics
Part 2 – Using Calculated Members in MDX
Part 3 – Aggregate Calculated Members in MDX
Part 4 – Using Calculated Members to Add Information
Part 5 – Working with Attributes in MDX Views
Part 6 – Working with Time Series in MDX Views
Part 7 – Using Lookup Cubes to Extend Your Queries
Part 8 – Joining Related Cube Data
Part 9 – Joining Related Cube Data(Part 2)
TM1/Planning Analytics – MDX Reference Guide
Working with Time Related MDX Functions