As big files with numbers are usually hard to read and make it difficult to spot patterns easily, MCi utilises Data Visualisation to transform a business’s numbers into an engaging story with details and patterns. This allows business to understand the data and rapidly consume important metrics leading to better, faster business decisions.
Utilising Microsoft’s PowerBI we can deliver a wide variety of Data Visualisation tools including:
Infographics
Data Animation
Barometer Tools
Interactive Maps
Data Storytelling
Survey Data Tools
Benchmarking Tools
Data Analysis
Data Driven Dashboards
Interactive Annual Reports
An example of our solutions include:
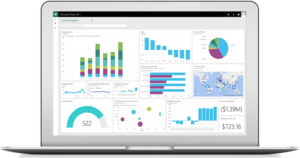
Data Visualization Dashboards specifically to assist Wealth and Investment Managers to optimize their business and operational performance metrics
We have developed an easy to implement, out-the-box Reporting Dashboard specifically to assist Wealth and Investment Managers to optimise their business and operational performance metrics.
Built utilising Microsoft Power BI, it is quick and easy to implement and can be customised for a client’s requirements.