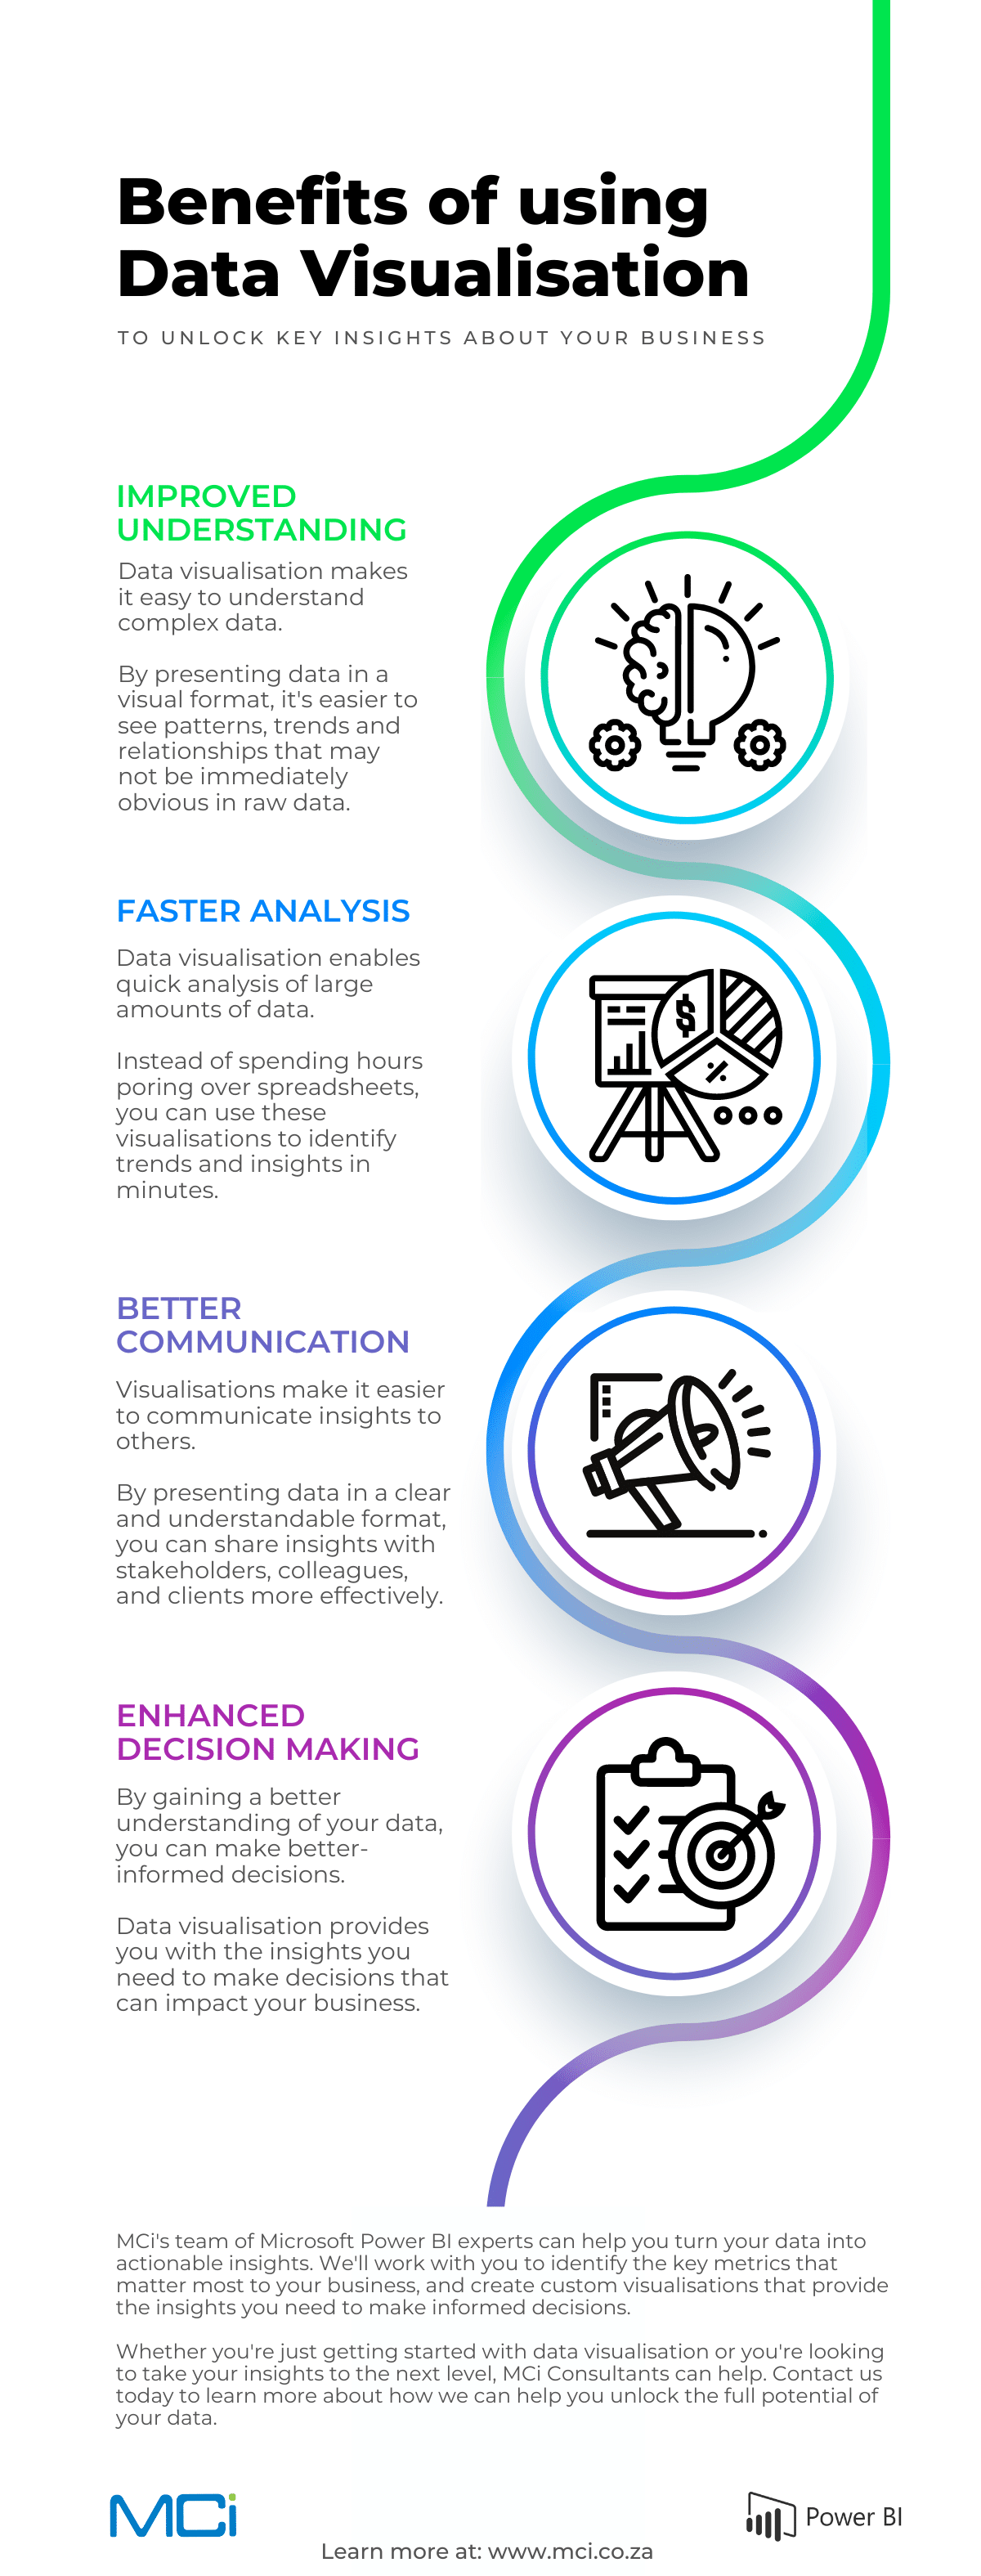
Benefits of using Data Visualisation
IMPROVED UNDERSTANDING
Data visualisation makes it easy to understand complex data.
By presenting data in a visual format, it’s easier to see patterns, trends and relationships that may not be immediately obvious in raw data.
FASTER ANALYSIS
Data visualisation enables quick analysis of large amounts of data.
Instead of spending hours poring over spreadsheets, you can use these visualisations to identify trends and insights in minutes.
BETTER COMMUNICATION
Visualisations make it easier to communicate insights to others.
By presenting data in a clear and understandable format, you can share insights with stakeholders, colleagues, and clients more effectively.
ENHANCED DECISION MAKING
By gaining a better understanding of your data, you can make better-informed decisions.
Data visualisation provides you with the insights you need to make decisions that can impact your business.
